
What building Vela taught me about turning a mockup into a real dashboard
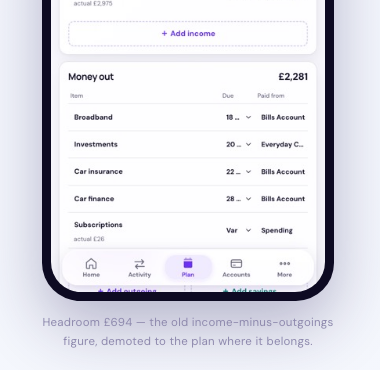
Vela started as a sample-data prototype — a way to see what a real personal finance dashboard could feel like before wiring it to anything real. Over the last couple of months it turned into something I actually use: donut charts you can click into, a cash-flow timeline that finally carries real dates on both sides, and enough small accessibility and correctness fixes that it stopped feeling like a demo.
None of the individual pieces were dramatic. Making a donut chart’s legend rows open into the actual bills and purchases behind each slice matters more for how honest the dashboard feels than any single feature does — you stop trusting a chart the moment you can’t ask it "why." Fixing a hardcoded month string that quietly dated every bill to July was a five-minute fix once found, and a good reminder that the boring bugs are usually the ones actually touching your real numbers.
The accessibility pass was the most satisfying stretch: text sitting at 2.64:1 contrast on a dark background is invisible to more people than you’d think, and fixing it isn’t a redesign, just attention.
Vela is still pre-integration with a real bank feed (TrueLayer sandbox is next), but it already tells the truth about the data it has — which turned out to be the actual bar.
Get Useful Personal Tech by email. One short email a week: one piece of tech I’ve tested, and whether it’s worth buying, upgrading or skipping. Free, unsubscribe in one click.
